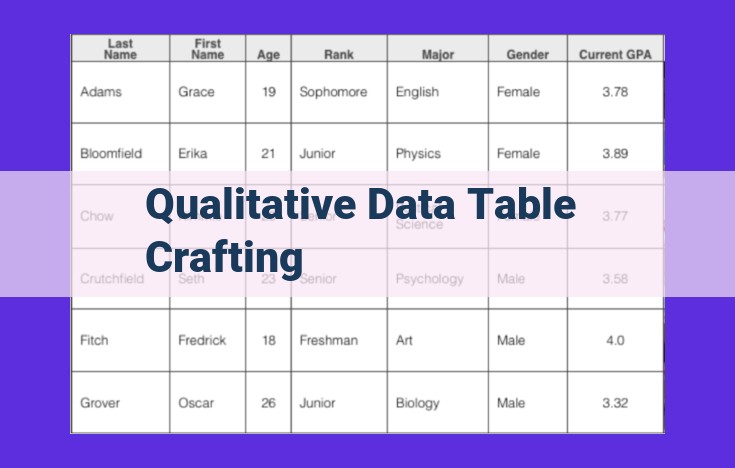
Crafting a qualitative data table involves structuring and organizing qualitative data into a tabular format. By defining variables and attributes, identifying categories and groups, and uncovering themes, researchers can establish a framework for data analysis. Coding techniques, such as tagging and labeling, facilitate the categorization and grouping of data. Content analysis methods, including text analysis and discourse analysis, provide further insights into the content and meaning of the data. The resulting data table or qualitative matrix serves as a visual representation of the research findings, enabling researchers to track progress, document insights, and draw meaningful conclusions from the data.
Defining Variables and Attributes in Qualitative Research
In the realm of qualitative research, variables are not fixed numbers or measurements, but rather concepts or characteristics that researchers observe and analyze. They are often descriptive in nature, capturing the essence and context of the data.
In contrast, attributes represent specific features or properties of variables. They provide detailed information about the variable’s nature and manifestations. For example, if “gender” is a variable, the attribute could be “male” or “female.”
Often, when working with qualitative data, variables and attributes are constructed through the process of coding. Researchers identify patterns and common themes in the data and then assign labels or codes to represent these key characteristics. By doing so, they create a framework for organizing and analyzing their findings.
Understanding the distinction between variables and attributes is crucial for crafting meaningful qualitative data tables. By identifying and defining these key elements, researchers can structure their data in a way that reveals insights and uncovers patterns.
Identifying Categories and Groups in a Qualitative Data Table
In the realm of qualitative research, where data unveils a tapestry of rich insights, the ability to discern categories, classes, and groups is paramount. These elements serve as the building blocks of our understanding, providing structure to the intricate web of information at hand.
Categories are the fundamental units of organization, representing broad and inclusive groupings of data. They encapsulate common traits or characteristics shared among a set of observations. For instance, in a study exploring consumer preferences, categories could include age groups, income brackets, or product types.
Classes delve deeper into the intricacies of each category, providing more granular subdivisions. They represent specific subsets within a category, characterized by unique qualities. Building on our consumer preference example, classes within the income bracket category could include low-income, middle-income, and high-income earners.
Groups, on the other hand, refer to clusters of observations that share a specific attribute or characteristic. They are often defined by a common theme or pattern that emerges from the data. For example, within the age group category, we might identify groups such as young adults, middle-aged individuals, and senior citizens.
The process of establishing categories involves a rigorous examination of the data, meticulously identifying commonalities and differences. Coding, an essential technique in qualitative research, plays a pivotal role in this endeavor. By assigning codes or labels to segments of data, researchers can systematically categorize and group observations, facilitating the identification of patterns and themes.
Through the careful delineation of categories, classes, and groups, researchers can structure their data, making it more manageable and interpretable. This process lays the foundation for further analysis and the uncovering of meaningful insights from the wealth of information at hand.
Uncovering Themes in Qualitative Data: A Narrative Exploration
In the realm of qualitative research, themes are the cornerstones of knowledge. They are the threads that weave together the rich tapestry of data, providing us with a deeper understanding of the complexities within. These themes emerge from the patterns and structures that emerge from the data, illuminating the underlying meanings and shared experiences.
Identifying themes is an iterative process, beginning with the careful examination of the data. As researchers, we immerse ourselves in the words, observations, and narratives, searching for patterns and connections. We ask ourselves: What are the recurring ideas? What are the commonalities among the different perspectives?
Through this process, we begin to develop ideas, which are tentative interpretations of the data. These ideas evolve as we refine our understanding, gradually forming into conceptual generalizations, or broader statements that encompass the patterns we have observed.
Uncovering themes is akin to embarking on a journey of discovery, where the researcher becomes a guide, leading the reader through the complexities of the data. The storytelling narrative provides a compelling vehicle for conveying these themes, drawing the reader into the heart of the research and providing a vivid understanding of the human experiences that lie at its core.
Coding Techniques and Applications: Unraveling the Patterns in Qualitative Data
In the labyrinthine world of qualitative research, coding techniques serve as a vital compass, guiding researchers through the vast ocean of collected data. Codes, like lighthouses, illuminate significant patterns and themes buried within the research material.
The first step in this coding process is to tag the data with labels that identify key concepts, ideas, and observations. These labels act as breadcrumbs, creating a trail that leads researchers back to the original data.
Once tagged, the data undergoes labeling, where researchers assign categories or groups to the tagged segments. This process organizes the data into meaningful clusters, akin to sorting a puzzle’s pieces into their corresponding shapes.
Finally, categorization takes shape, where the labeled data is merged into broader categories that encapsulate the overarching themes and patterns. This step transforms the fragmented data into a cohesive mosaic, revealing the insights and understanding hidden within.
Through this meticulous process of coding, labeling, and categorization, researchers forge a path through the darkness of qualitative data. They unravel the intricate threads that connect the research material, uncovering the tapestry of understanding that lies at the heart of their investigations.
Content Analysis: Exploring Different Approaches
When it comes to analyzing qualitative data, content analysis plays a crucial role in extracting meaningful insights. Content analysis is an umbrella term that encompasses various approaches, each tailored to specific research objectives. Let’s delve into the three prominent types of content analysis:
Text Analysis
Text analysis focuses on the surface-level meaning of written or spoken text. This approach involves identifying and interpreting words, phrases, and sentences to uncover patterns and themes. It is particularly useful for examining the explicit messages conveyed in documents, interviews, or social media posts.
Discourse Analysis
Discourse analysis goes beyond the surface level and delves into the underlying structures and contexts of communication. This approach examines how language is used to create meaning and how it reflects social and cultural norms. Discourse analysis is commonly employed in analyzing political speeches, media articles, and online conversations.
Communication Analysis
Communication analysis examines the process of communication. This approach considers the sender, receiver, message, channel, and feedback involved in communicative interactions. It seeks to understand how communication shapes relationships, influences behavior, and creates shared meanings. Communication analysis is often used to analyze organizational communication, interpersonal dynamics, and mass media effects.
Each type of content analysis offers unique perspectives on qualitative data. By understanding the nuances of these approaches, researchers can select the most appropriate method for their research goals and extract rich insights from their data.
Constructing a Qualitative Data Matrix
In qualitative research, data organization is crucial to uncover meaningful patterns and insights. A data matrix, also known as a qualitative matrix, serves as a powerful tool for organizing and analyzing qualitative data.
The primary purpose of a data matrix is to provide a systematic structure for coding, categorizing, and identifying themes within the collected data. By arranging data into rows and columns, researchers can easily compare and contrast different variables and attributes, leading to a deeper understanding of the findings.
Various software programs and tools are available to assist in data matrix construction. However, researchers may also opt to create their own matrices using spreadsheets or word processing software. The layout of the matrix depends on the specific research question and the nature of the data collected.
Rows in the matrix typically correspond to cases or participants, while columns represent variables, attributes, or categories. The cells within the matrix are filled with qualitative data, such as text excerpts, quotes, observations, or codes.
By carefully organizing the data in a matrix, researchers can identify patterns, recurring themes, and relationships between variables and attributes. This aids in the development of conceptual generalizations and the formulation of meaningful conclusions.
Documenting the Research Process
- Emphasize the importance of an analytic memo, research journal, field notes, and researcher’s log.
- Explain how these tools aid in tracking progress and documenting insights.
Documenting the Research Process
In the realm of qualitative research, meticulous documentation is paramount. As you navigate the uncharted waters of your study, an arsenal of tools is at your disposal to chronicle your progress and capture the valuable insights that emerge along the way.
Foremost among these tools is the analytic memo. This living document serves as a repository of your thoughts, observations, and evolving ideas. Jot down your aha! moments, ponder potential interpretations, and meticulously track the evolution of your understanding.
Complementing the analytic memo is the research journal. Within its pages, you can chronicle your day-to-day experiences in the field, recording encounters, interactions, and the rich details that often escape formal data collection methods. This journal not only preserves the human element of your research but also provides a source of inspiration for future analysis.
Field notes are the raw material from which your research tapestry is woven. In these unvarnished accounts, you capture the unfiltered observations of your participants, the nuances of their experiences, and the context surrounding your interactions. Whether it’s a whispered confidence or a poignant gesture, field notes serve as an invaluable time capsule of the research process.
Rounding out this quartet of documentation tools is the researcher’s log. This is a personal space for you to reflect upon your own experiences, biases, and the impact of your presence on the research. By acknowledging your own subjectivity, you can enhance the validity and authenticity of your findings.
Together, these tools form a comprehensive record of your research journey, capturing not only the observable data but also the intangible insights and emergent understandings. As you revisit your documentation, you’ll discover hidden patterns, unexpected connections, and the threads that weave together the tapestry of your research.